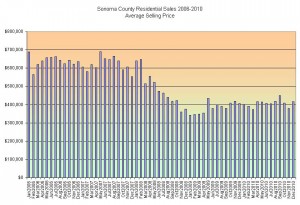
I will do a lot of posts looking at home sales in individual towns over the next few months. I’ll break down the results by REO vs. short sales vs. open market sales. I’ll look at unit sales, average prices, Days on Market and other statistics that help at the level of an individual buyer or seller of a specific property. What all that analysis will not do is give you a clearer snapshot of real estate in Sonoma County over the last five years than this chart.
Past trends aren’t necessarily a predictor of the future. The stable results from 2010 may look a lot more erratic for different cities or different price segments. Tighter lending standards and rising interest rates may put downward pressure on prices. Continued high unemployment is keeping many otherwise qualified buyers out of the market. Many people trying to relocate to Sonoma County can’t sell their homes in Washington, Colorado, or other parts of California, so the impact of their buying power is still in the future. Despite those pitfalls that still litter the housing market, I’m pleased to see that the bottom of the Sonoma County real estate market that I predicted in April of 2009 still seems to be holding.