Full price isn’t high enough.
It’s strange to write those words after six months of free-falling home values in 2008 and four years of bumping along a fitful bottom since then.
What we are seeing both nationally and locally is that owner occupants and investors have returned to the market in large numbers. We are seeing record low residential inventories for sale and the emergence of a strong sellers’ market. For buyers, the emerging problem is that the tight inventories may persist. There’s a chance that the improving market may finally convince more sellers that now is the right time to sell, but until the listings start appearing, there are too many buyers chasing too few homes.
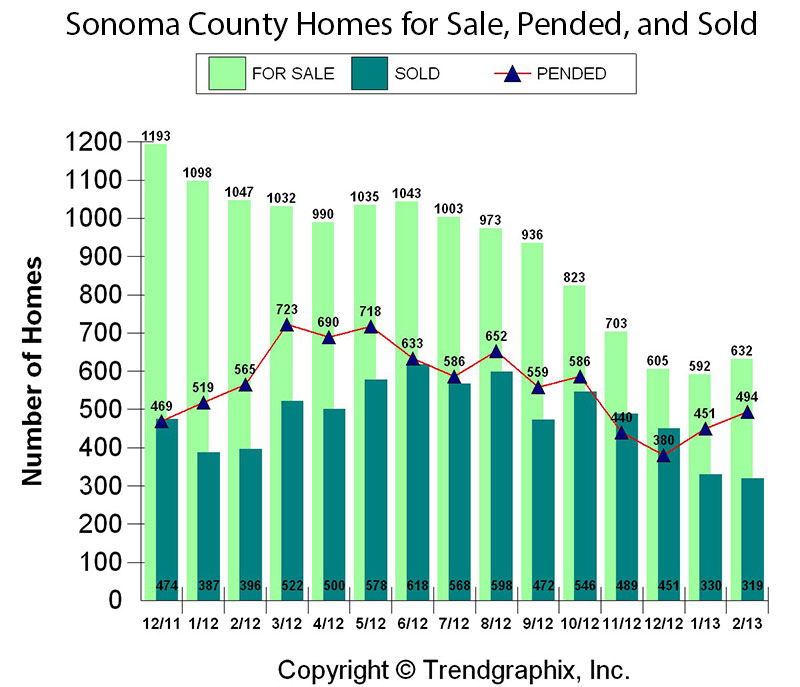
I did some analysis of all Sonoma County home sales for the first two months of 2013. Not surprisingly, the lower inventory has produced fewer sales than we had last year at this time. The first chart is for all residential activity, both single family homes and condos. There are three pieces of information in the chart for each month; the number of homes for sale, the number that are pended (meaning a contract is in place and all contingencies have been removed), and the number of homes sold. I know graphs are painful and you probably want to skip over it, but the charts in this post explain a lot about the real estate market, so please bear with me. Look at the light green column for January 2012. It’s the second column in from the left. The number at the top of the bar is 1098. That’s how many homes were for sale a year ago in January. Now look at the corresponding chart for January 2013. It’s the second from the right and the number of homes for sale is 592, a little more than half as many. The dark green columns for January and February of 2012 show sales of 387 and 396 homes respectively. The same months for 2013 show sales of 330 and 319 homes. It’s a significant fall off in sales, but you can’t look at the chart without noticing that there just aren’t as many homes to choose from.
The other piece of data to pay attention to is the red line running across the charts. Those are “pended” sales that show up in the sales figures, typically for the next month, but sometimes longer. They are a leading indicator of where sales are going. You can see that both January and February of 2013 show pended sales that are very strong relative to the number of homes on the market. (Please click on this or any other chart on this blog to see a larger version.)
That chart, believe it or not, has the good inventory numbers. It includes all price points including the luxury estate property in Healdsburg and Sonoma that drives the wine country lifestyle dreams of so many buyers. The battle for the first rung on the ladder of home ownership is fought at entry level pricing. I’m going to arbitrarily call Sonoma County entry level housing at up to $300,000.
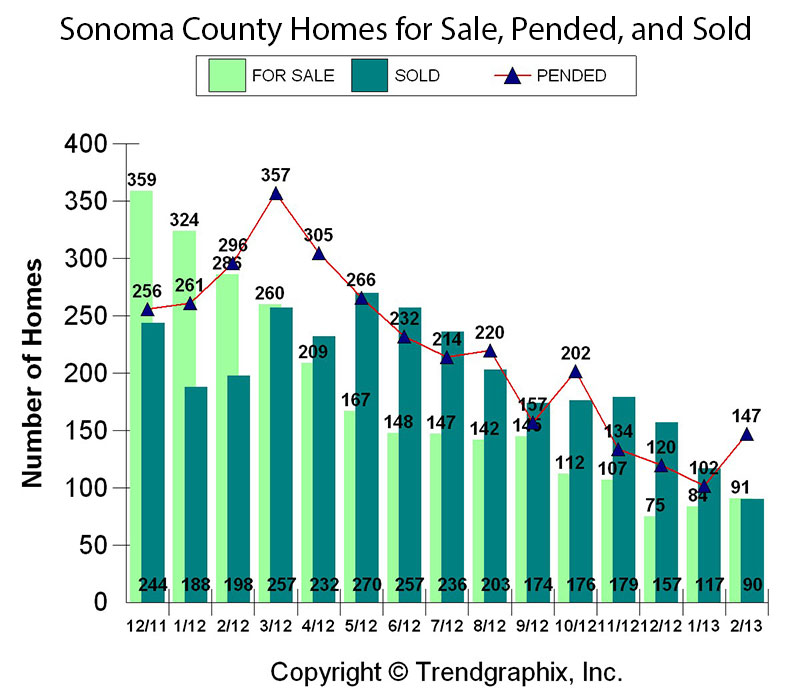
I prepared the same chart as above, but just for entry level housing. This is seriously scary for anyone who wants the American dream of home ownership available to all. Compare January and February of 2012 to the same months in 2013 for the For Sale and Sold columns. The light green of For Sale is almost invisible in 2013, buried behind strong sales represented in dark green. In fact, since April of 2012, the number of homes sold has outpaced the number available For Sale. The trend analysis (red line) shows the market continuing to take off in February of 2012 with more pended sales than available homes. That’s not a tight market. It’s crazy.
When buyers sense a market that isn’t slowing down to let them jump on, they only have a couple of alternatives. One is to stay on the sidelines and continue as a renter or a stuck-in-place home owner. The other is to jump in and grab what they can…paying what they have to. That’s the origin of the lead sentence where I say “Full price isn’t enough”. The final chart is an analysis of the selling price for all the homes compared to the listing price. Other terms for listing price would be full price or asking price. It’s what you see when you look at the price of a home online. What my new chart and the data behind it is telling us is that a lot of homes are selling for more than their full price. If you are planning on jumping into this market, be warned that even if you make a full price offer, there is a good chance that someone else may end up buying the home.
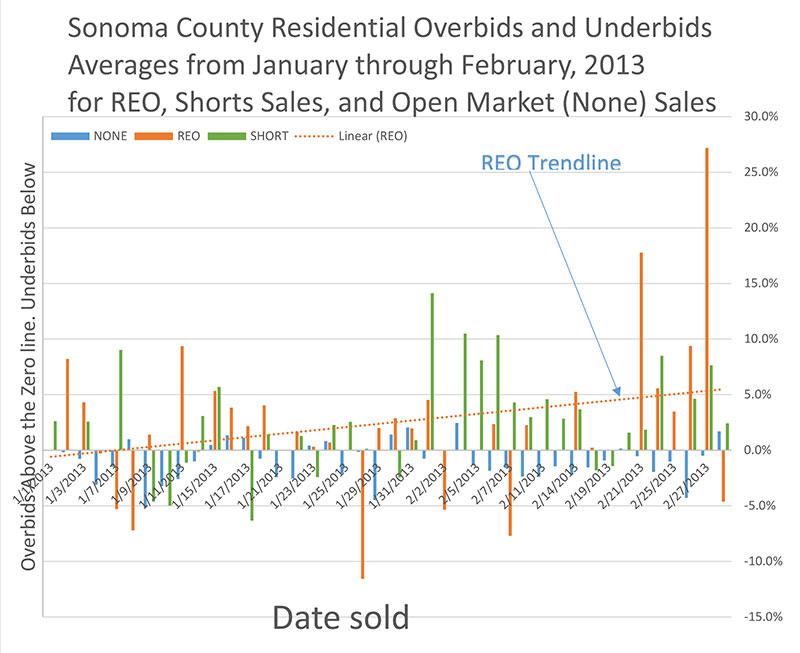
Reading this chart is a little different than the first two. The key element here is a horizontal line running across the chart at 0.0%. That represents the asking price for a home. Any vertical bar above that line means the average of homes sold that day was for more than the listing price. If the bar is under the zero line, people paid less than asking price. The chart starts on January 1, 2013 on the left and finishes at February 28, 2013 on the right. Again, the vertical lines represent the average of the overbids and underbids for three types of properties:
- REO or bank owned properties (orange)
- Short Sales where the bank must accept less than is owed on the home (green)
- None which represents a traditional owner selling their home for more than the outstanding mortgage. (blue)
Take a deep breath and stay with me. This chart is going to help you think about your strategy for buying a home. Let’s start with some clear facts:
- The traditional open market home sales (in blue) are typically selling for less than asking price
- REO homes are typically selling for up to 5% or more over the asking price
- Short sales are likely to be selling for more than asking, but not by as much as REO listings.
- The pricing trend line for REO homes is climbing. Pricing designed to get multiple offers is working.
Please keep in mind that these are averages. Different neighborhoods, quality of improvements, lot size, and other factors still play important roles. Learning as much as you can about the inventory and recent trends is key to making a smart offer. Knowing whether you are looking at an REO property, a short sale, or an open market sale will help determine whether or not you will offer over the listing price or not. Knowing what has sold in that neighborhood recently will also be an important factor. Even with perfect knowledge, a great lender, a fantastic agent, and a winning smile, you can still lose out with a thoughtful offer. You may have run into a more desparate buyer who wants it more. You may be competing with an all-cash investor who is willing to pay above market prices to get another rental unit. What is guaranteed is that if you understand what the market is doing, you will be making smart offers in line with current trends. Reading this blog post has hopefully made you a smarter buyer. Putting that brain power to use on your next offer will hopefully make you a more successful one.