I plead guilty to liking numbers. I don’t track the Giants batting averages, but I do know how much houses in Sonoma County are selling for. I also know which areas are hot and which could use more buyers.
As a potential buyer or seller of a home in Sonoma County, watching these trends for pricing and market demand makes you a better decision maker.

Some Observations
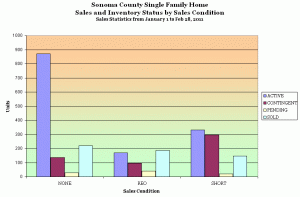
1. The first surprise for many people is that the cluster of REO columns in the middle has no tall bars. There just aren’t a lot of active bank owned listings in Sonoma County. Next, notice that the three columns on the right side of the REO cluster contain more total height than the “active” column. Even the sold column (on the right of the middle cluster) by itself is higher than the active column. Translated for buyers:
Sonoma County doesn’t have many available REO listings. The ones that do come on the market get sold quickly.
I’ll show that in the next chart.
2. Another clear observation to be drawn is that regular, open market sales still have plenty of inventory relative to sales (look at how tall the left-most bar is in the left hand cluster). In Sonoma County it looks like about a four to five month inventory of unsold homes (not REO and short sales). That’s not bad compared to some parts of the country that are looking at more than a year’s worth of unsold inventory.
3. There are almost as many contingent short sales as active short sales. These are the transactions that drive everyone crazy due to the uncertainty of bank approvals, desperate behavior by some second lien holders, and sheer anxiety of waiting, and waiting, and waiting.

Some DOM Observations
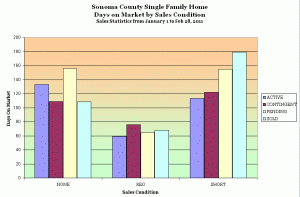
1. The sold column in the right cluster (short sales) represents half a year. The comparable numbers for “none” and REO are three and a half months and two months respectively. This far longer sales cycle is one reasons agents and buyers are reluctant to get involved with a short sale.
2. The average DOM for an REO is half that for an open market sale. We’re looking at an average of around 60 days for listings and sales. That’s fast in any book.
3. The approximate active DOM for open market sales is close to four and a half months. That tracks very closely with the data on inventory levels in the first chart which indicates a market absorption rate that would add up to a four and a half month supply of homes.
Of course, this is a sales and inventory report from the first two months of 2011. We are likely to see surges of new homes coming on the market as the traditional selling season picks up steam. That will change the specific numbers, but I think the trends from these charts are clear.
- REO sales continue to be hot.
- Short sales continue to take a long time.
- Open Market sales have a relatively larger inventory than the other categories, but are selling within four months on average.
For the easiest viewing of REO properties using easy to navigate maps, please visit reo.sonoma.net