Don’t believe everything you read. Especially from me. I love looking at data to figure out trends, but using a six month snapshot of average residential sales prices runs the risk of skewed results from a few great sales…or a few lousy ones.
Sonoma County has a huge variety of real estate available. We have built our housing in spurts over the last 150 years. There was the creation of a complete city in the 1960’s in Rohnert Park. Sleepy Windsor had a giant growth spurt from the 1980’s to 2005. Healdsburg has its Parkland Farms area on the north end of town, Cloverdale has the Del Webb and other newer subdivisions and Petaluma’s entire east side is a relatively newer area compared to the old neighborhoods like D Street and Kentucky.

In addition to age differential, our properties range from tiny urban lots to substantial rural estates, many with commercial vineyards, old apple orchards, equestrian facilities, or redwood forests. Some lots have summer cabin architecture without insulation or insulated windows. Others have “Tuscan villas” or conemporary green architecture and construction. In other words, there is no standard Sonoma County residence. The process of pulling “comps” is very important when evaluating a specific property to buy or sell. That’s not what I am doing here.
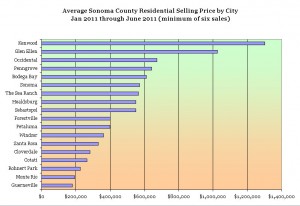
This chart shows average prices for every city in Sonoma County that had at least six sales in the first half of 2011. I think it’s useful as a rough guideline of relative valuations. For instance, if you are house hunting in the $400,000 range, this chart will help you understand that Kenwood or Glen Ellen or Guerneville may not be the area with a lot of listings in your price range. You may find just what you’re looking for, but you would probably have a better selection if you were looking in Petaluma or Windsor.

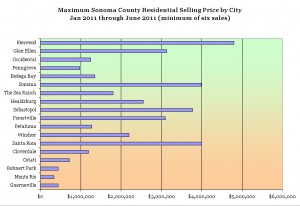
Averages are a rough way to get at valuations. Another way is to show the top end of the market to see what each city has done so far this year. There are some transactions that have happened outside the MLS that don’t show up on this chart. I know of sales in Healdsburg, for instance, that would raise the maximum value by several million dollars. However, to be fair to the market, this chart only shows sales as reported to the MLS. The cities are listed in the same order as they are shown in the first chart.
For buyers of luxury wine country properties, this chart can demonstrate the current market and show which cities support the highest value properties. If you intend to invest millions of dollars in Sonoma County real estate, you need to know where your likely neighbors are living.
Please click on images for a larger version.